At a glance:
- kegg detects the changes in your cervical fluid to both predict the fertile window based on past trend data and to show the user in real-time the changes in their fertility
- During the first cycle, the fertile window prediction is based on the cycle length you enter at start-up as kegg needs to learn your unique trends.
- The app displays your fertile window prediction which is made at the start of the new cycle and displayed in green on the cycle view. The fertility status displays “low” fertility on days outside of this prediction, and “possible” and “likely” within this predicted window. This prediction does not change based on day-to-day readings.
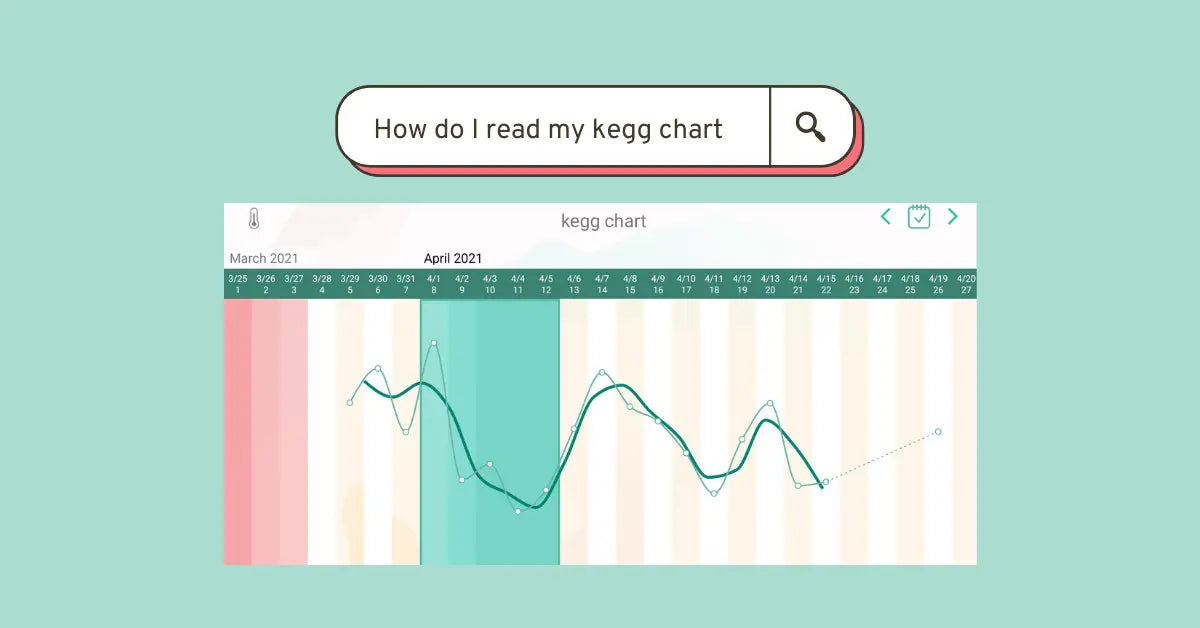
- The kegg user should watch the dark green line, the trendline, to spot the fertile valley. The fertile valley appears as a descent in the kegg readings. This descent indicates the fertile valley may be opening and the vaginal environment is becoming more hospitable to sperm
- The full valley, from the start of the descent through the rise should be considered potentially fertile.
- It is common to see another descent in the luteal phase, or the time between ovulation and the start of the new cycle
- In cycles of those who have PCOS or irregular cycles, it is common to see multiple fertile valleys. It is a good idea to time your trying to conceive efforts during these fertile valleys.
How kegg works
kegg predicts your peak fertility by sensing the key indicator to detect your fertile window and when you’re most likely to conceive: cervical mucus. Following a daily reading – which takes only two minutes to complete – kegg will send your data to the cloud for analysis. In real-time, the device connects to a FREE mobile app which displays daily fertility status, cyclical trends, and fertility predictions. Optional fertility tracking items like Body temperature, LH testing, and Cervical fluid observation can be manually added in your app’s daily notes but do not impact kegg’s algorithm.
The technology
By using advanced sensing technology known as impedance, kegg detects changes in electrolyte levels in your cervical mucus that occur when your fertile window opens and closes. The electrolyte changes in the cervical fluid correlate with the various reproductive hormones that fluctuate throughout your cycle. As your body prepares to ovulate and estrogen increases, the kegg values will typically begin to descend, or move downward on the y-axis. When you begin to see this downward trajectory, it clues you in that you are likely entering your fertile window. After ovulation, the shift from estrogen to progesterone dominance results in a rise in your kegg data.

Your first cycle with kegg
For the first full cycle, kegg places the fertile window prediction based on the cycle length you provide when you set up your account. This means kegg predicts an average luteal phase length and places your fertile window before that. Why isn’t kegg predicting your fertile window based on your readings for this cycle? Because kegg has not had the opportunity to learn about your unique cycle yet, it needs to gather information regarding your kegg data and trend during this first cycle. kegg will continue to learn about you with each cycle of consistent use. After this first cycle, kegg will use its predictive algorithm to predict the placement of your next fertile window. It becomes more and more personalized with each cycle of kegg data.
What to look for
kegg will provide information in 3 areas that women who are trying to conceive should look for:
Fertility Status
On the kegg app’s home page you will find your predicted fertility status labeled as LOW, POSSIBLE, or LIKELY. The fertility status of “Possible”, and “Likely” are labels within the predicted fertile window and correlate to the green days seen in your cycle and calendar. These labels indicate that conditions may be right to achieve a pregnancy on these days. All other days will be predicted to be “low”, indicating that the chances of conception on those days are predicted to be less likely. The first 2 days of the predicted fertile window are labeled “possible” and days 3-5 are labeled “likely” The labels do not indicate the ovulation day but instead the likelihood that the vaginal environment will be hospitable and conception could result due to intercourse or insemination.

The Green Fertile window prediction
When you look at your kegg cycle in the kegg app, you will see the days of the cycle. 5 of those days will be the predicted fertile window, in green. The other days will appear to be in white or yellow, meaning there is a low likelihood of conception possibility during those days.
In some cases, there may not be a predicted green fertile window if your previous cycle(s) was greater than 40 days or less than 21 days in length.

The Trendline
The trendline display puts emphasis on the overall trend of readings rather than day-to-day fluctuations. The trendline helps users see that while the readings themselves may be fluctuating, the overall trend is downward or upward.

Your daily kegg readings and “fertile valley”
Consistent daily kegg readings can present in many different ways. There is a typical overall pattern of readings dropping lower as you approach the Fertile window and readings rising after the fertile window. We call this “the fertile valley”

For both the trend line and daily readings, users will most often see a “fertile valley” in or near their predicted fertile window. Some cycles can have a single day drop or very subtle shifts through the cycle. For these cycles the trend line may stay relatively flat. Kegg is able to detect even these subtle changes so no squinting is necessary! You take consistent daily readings and kegg will do the rest.
One day drop

Subtle “flat” data

Following cycles
kegg is able to put its intelligent algorithm to work to predict your fertile window. Factors the algorithm considers include the previous cycle(s) length(s), previous trendline data and fertile window timing. After your first cycle is under its belt, kegg does a “look back” to analyze your trend to confirm the placement of the fertile window. When you start the next cycle, you will notice your fertile window from the previous cycle will have a dark green border or a dashed-border. The dark green border signifies the algorithm was able to confirm your fertile window whereas the dashed-border indicates there were not enough readings to confirm the fertile window.
Active cycle

Confirmed at completion

Not enough data - too many missed readings

Taking your daily kegg reading at a consistent time leading up to, in, and after you fertile window prediction will allow kegg to make the most personalized predictions and confirmations.
Common questions
Did I ovulate?
To maximize your chances of conception, kegg’s job is to predict the full fertile window. kegg does not predict ovulation day and the lookback fertile window confirmation also does not identify ovulation day.
However, after the fertile window is complete, you can review your fertile valley and suspect ovulation occured on the first day of the rise, or the day preceding this. If you received Proov with your order, you can confirm ovulation days 7-10 after the rise. Use the first day of the rise as day 1 of your count.

While it is tempting to assume your ovulation was healthy looking at your fertile valley alone, keep in mind this does not confirm ovulation indeed occurred, or was adequate. Since ovulation cannot be confirmed until after it has occurred, and the egg can survive for only 12-24 hours, trying to time intercourse on ovulation day is not only difficult but also limiting. Further, conception is more likely to occur from intercourse 2-3 days before ovulation. With kegg, you can see all the days of your fertile window and take the stress out of trying to predict the exact day of ovulation.
What if you see a valley before or after the predicted fertile window?
In the first 2-3 cycles kegg is learning your unique cycle trends. kegg relies on the user providing consistent data, which is taking readings throughout the cycle at a consistent time of day. In the first cycle kegg will place a best guess prediction based on the information provided by the user during their account setup. If your cycles lengths vary significantly,* it may take more time for kegg to learn your cycle trends. While kegg is learning, or if you are having an irregular cycle due to stress, travel, or illness, you can watch for downward trends and have sex on days with descending readings to maximize your chance of conception.
*kegg is best suited for users with regular cycles that are more than 21 days long and do not exceed 40 days. If you regularly have cycles shorter than 21 days or longer than 40 days, a fertile window prediction will not be displayed.
Should I follow the trend line or my single daily readings?
The trendline and daily readings line can be thought of as partners to help you see your overall trend in readings. Users will sometimes put too much focus on day-to day fluctuations but kegg’s intelligent algorithm does the work for you by assessing your readings and cycle trends to determine the best fertile window predictions. The trend line will help to better see the overall trends if your day to day readings fluctuate significantly.
In this example we see there is a one day rise in the middle of this user’s fertile window. The trendline helps to see that the trend of readings is still lower than the readings before and after the fertile window.
Want to learn more?
You’re in luck. From improving your fertility through your diet, to successful pregnancy stories from kegg users, we have got you covered.
