
Welcome to kegg! This beginner-friendly guide will walk you through each piece of information you see in your kegg chart and explain how it can help you better understand your fertility. For more information about getting started with kegg, please visit our start-up guide.
The Power of kegg's Technology
kegg works by detecting the changes in the vaginal environment to show you your most fertile days.
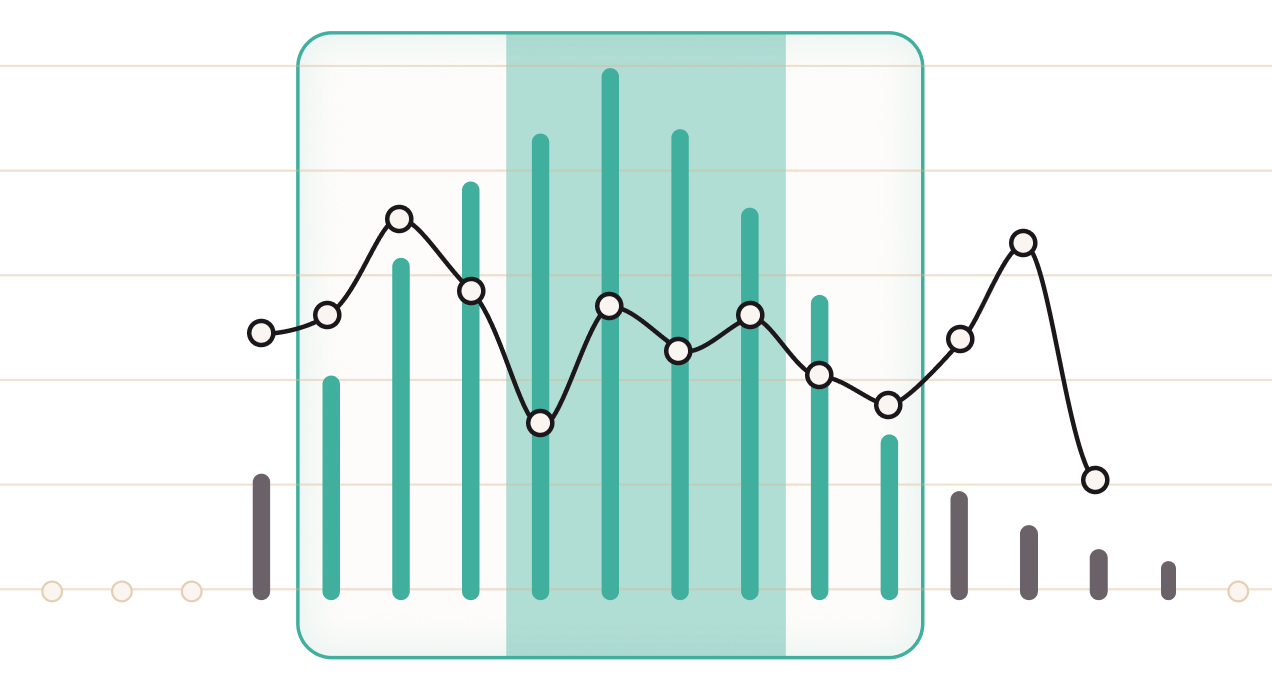
kegg displays a combination of estimated data (that which is based on your past cycle data) and real-time kegg readings, which is each small circle on your kegg chart connected together by the black line.
kegg’s algorithm becomes more personalized with consistent, daily use on all non-bleeding cycle days. For the most personalized kegg experience:
- Use kegg consistently throughout your cycle.
- Take your daily reading in the same 2-hour window when possible.
For example, if your target time to use kegg is 8 AM, your two hour window will extend from 7-9 AM.

Keep in mind - life happens! If you forget or can’t take your reading during your usual window, it’s better to take a reading later than to skip it altogether. Every data point helps build a more personalized picture of your unique cycle.
The Fertile Window Estimate
The green outlined fertile window shows you the days when you’re most likely to be fertile, based on your unique cycle patterns. For your first cycle with kegg, this window will be based on the information entered during account set-up, as kegg needs at least one full cycle to learn from your kegg readings. You can help kegg learn about your cycle variability more quickly by adding at least your four most recent periods to the kegg calendar.
After your first full cycle with kegg, your fertile window estimate will also factor in your past cycle kegg readings.

Peak Fertility Window
Shaded in green, your peak fertility window highlights your most probable highest fertility days, also known as the days that intercourse or (fresh) insemination is most likely to result in pregnancy. You’ll see your peak fertility window in advance so you can plan accordingly.
Fertility and Cervical Mucus Scores (and Bars)
After you take a reading, you will see your Fertility and Cervical Mucus Score displayed on your kegg app. These scores estimate your fertility level each day, based on what kegg knows about you - including any past cycle kegg readings, past periods, and information entered during account set-up. The higher the score, the more fertile kegg predicts the cycle day to be.
These scores become more personalized with consistent use, and the scores reflect kegg’s confidence that a given day is fertile. Since several factors impact scores, you may note that your scores do not get as high as others if your cycles tend to be irregular, your kegg use is inconsistent, or if you are new to kegg.

Your Fertility and Cervical Mucus Scores are plotted on the cycle view as bars. When you are in your fertile window, your bars will appear green. When outside of your predicted fertile window, the bars will appear gray. The y-axis corresponds to these scores.
Think of these scores as kegg's best estimate of when your most fertile days may occur, based on your past data.
Ovulation Probability
The kegg app can predict your most likely ovulation days. If your ovulation probability is toggled on in the cycle view, you will be able to see your most likely ovulation days at the start of a new cycle. These are the most likely ovulation days, based on your past cycle data.
While it is interesting to note your most probable ovulation day, keep in mind that ovulation day has a lower chance of resulting in pregnancy than the days leading up to ovulation, which is why you'll see higher Fertility and Cervical Mucus Scores preceding these cycle days.

The Impedance Trend
This is the line on your cycle chart which reflects the real-time changes in your vaginal environment. There are numerous changes throughout the cycle, and the impedance trend reflects these changes.

The Fertile Valley
The impedance trend forms a valley, known as the “fertile valley” during your most fertile days. As your most fertile days begin, the impedance trend begins to move downwards on the cycle view. As the fertile window draws to a close, the kegg readings rise back up again. The full valley, from the beginning of the descent through the rise should be considered fertile.
 Watch your impedance trend day by day. Your fertile valley will most likely occur during your estimated peak fertility window. If possible, time your baby making efforts throughout the full fertile window. If you are limited on attempts, target a day on the descent into the valley, or a day low in the valley. If you are using frozen sperm, aim for the last day before the rise out of the valley or the day of the rise. Ovulation most commonly occurs on the last low day in the valley or on the day of the rise out of the valley.
Keep in mind that LH rises towards the end of the fertile days, however, some of the most fertile days often occur before this LH surge. If you also track your LH, it is best to not wait for your LH to surge to begin timing your trying to conceive efforts.
Note: The scores on the y-axis correspond to the Fertility and Cervical Mucus Score (and not the impedance trend).
Putting the Pieces Together

It is best to look at kegg’s data points as a set. The fertile window and peak fertility window estimates help you identify when you are most likely going to be fertile. As the score rises, there is a higher likelihood those days are highly fertile. The impedance trend helps you see the real-time changes in your vaginal environment, and allow you to optimally time your trying to conceive efforts accordingly (during your full fertile window). The ovulation probability gives you the insight of when ovulation is most likely to occur, to help you identify when your two week wait starts.
Your Chart, Your Journey
No two cycles are the same, and your chart will become more insightful over time. It is very normal to see bumps and dips both before and after the fertile days in your impedance trendline. Each fertile valley is unique; some are deep and pronounced, some are shallow, and some are limited to a single day dip. All of these variations can result in pregnancy! Whether you’re just starting or have been tracking for a while, remember: your kegg chart is a personalized window into your fertility.
If you ever have questions, we’re here to help. If you haven’t already become a part of the kegg community, we would love to have you! It is a wonderful way to connect with others on a similar path!

